What is OpenTelemetry, and why does it matter for AI agents?
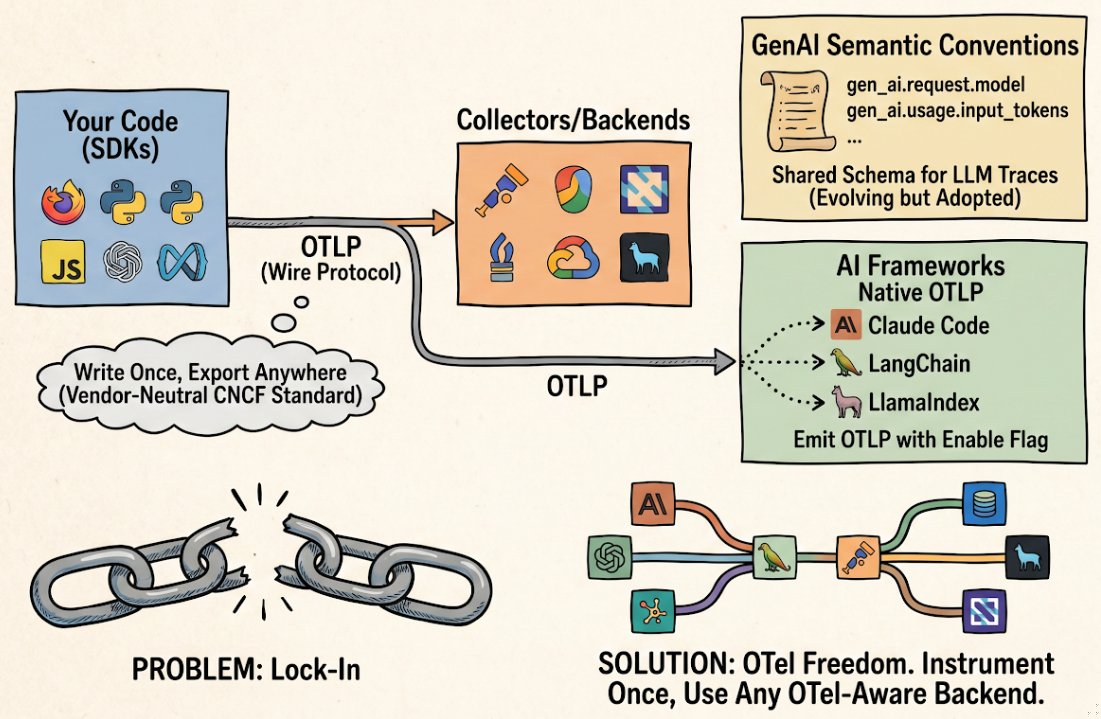
OpenTelemetry is the Cloud Native Computing Foundation’s standard for collecting and exporting observability signals (traces, metrics, and logs) from applications. Instead of locking you into a single vendor’s telemetry format, OpenTelemetry defines how applications emit telemetry data in a vendor-neutral way, using the OpenTelemetry Protocol (OTLP). You instrument your code once and can send your telemetry to any compatible backend: Datadog, New Relic, Grafana, Jaeger, or any other system that speaks OTLP.
The three components: SDKs, OTLP, and backends
Three moving parts.
1. SDKs (instrumentation in your code)
An OpenTelemetry SDK is a library that runs in your application. It collects traces, metrics, and logs from your code and hands them off for export. You install it, configure it, and call its APIs (or rely on auto-instrumentation) to emit telemetry. For Python agents, the OpenTelemetry Python SDK is the foundation. For TypeScript, OpenTelemetry JavaScript serves the same purpose.
SDKs do the heavy lifting. They manage span lifecycle, batch telemetry, apply sampling policies, and handle backpressure when backends are slow. Different instrumentation libraries (for LangChain, Anthropic, Ollama, and others) sit on top of an SDK and emit standardized spans into it.
2. OTLP: the wire protocol
OTLP (OpenTelemetry Protocol) is how telemetry gets from your SDK to a backend. OTLP runs over gRPC or HTTP/1.1, uses Protocol Buffers for encoding, and specifies backpressure handling and retry semantics. You don’t think about OTLP directly. It’s configured via environment variables like OTEL_EXPORTER_OTLP_ENDPOINT and OTEL_EXPORTER_OTLP_HEADERS. It’s the contract between your SDK and any backend that claims OpenTelemetry support.
3. Collectors and backends
An OpenTelemetry collector is a standalone service that receives telemetry data via OTLP and routes it to backends, applies transformations, and handles batching at scale. A backend (Datadog, Grafana Loki, Jaeger, Honeycomb, and others) stores and queries your traces. You can skip the collector for small workloads. Many apps export directly to a cloud backend via OTLP. Collectors give you flexibility: they let you filter and enrich telemetry before it hits your backend, and they buffer data when backends are slow.
Why agents need OpenTelemetry specifically
Vendor lock-in is real for observability. If you instrument your agent to emit telemetry in Datadog’s proprietary format, switching to New Relic means rewriting instrumentation across your codebase. For organizations with many agents and teams, this tax is enormous.
OpenTelemetry fixes this by making the instrumentation the constant, not the vendor. Your agent code emits OTLP. Your backend is the variable. You can migrate backends, or use multiple backends simultaneously, without touching your instrumentation layer.
This matters more for agent teams because agent complexity is growing. A modern agent traces LLM calls, tool invocations, retrieval steps, and agent reasoning across multiple frameworks and runtimes. A shared observability standard means you’re not training teams to emit telemetry differently for each agent tool; they all follow the same conventions.
The GenAI semantic conventions
OpenTelemetry includes a specification for semantic conventions: standardized attribute names and meanings that make spans interoperable across backends. For generative AI, the OpenTelemetry GenAI semantic conventions define how to structure traces from LLM calls and agent steps.
Key attributes include:
gen_ai.system: the GenAI system or LLM provider (e.g.,openai,anthropic,ollama).gen_ai.request.model: the name of the model being invoked (e.g.,claude-3-5-sonnet).gen_ai.operation.name: the operation type (e.g.,chat,completion,embedding).gen_ai.usage.input_tokensandgen_ai.usage.output_tokens: token counts from the LLM response.gen_ai.response.id: the response ID from the model provider.gen_ai.agent.id,gen_ai.agent.name,gen_ai.agent.version: identity and version of the agent.gen_ai.conversation.id: unique identifier for a conversation thread (for multi-turn traces).
These conventions are actively evolving; the specification is not frozen. That’s by design. As new use cases emerge (tool use, function calling, retrieval-augmented generation, multi-agent coordination), the spec grows. Tools that adopt the conventions now benefit immediately. They gain interoperability across backends even as the spec matures.
Adopting these conventions in your agent instrumentation means any OpenTelemetry-aware backend can parse and query your traces without custom parsing logic. You get consistent dashboards and analytics across vendors.
How real agent runtimes emit OTel today
OpenTelemetry adoption in the agent ecosystem is accelerating. Concrete examples:
Claude Code
Claude Code natively emits OpenTelemetry traces when you set the CLAUDE_CODE_ENABLE_TELEMETRY=1 environment variable. You then configure where traces go using standard OTEL environment variables:
export CLAUDE_CODE_ENABLE_TELEMETRY=1
export OTEL_EXPORTER_OTLP_ENDPOINT=https://your-backend.example.com:4317
export OTEL_EXPORTER_OTLP_PROTOCOL=grpc
For full configuration details, see the Claude Code environment variables documentation.
LangChain
LangChain supports OpenTelemetry instrumentation via the opentelemetry-instrumentation-langchain package. You instrument your LangChain app and export via any OTLP-compatible backend:
from opentelemetry.instrumentation.langchain import LangchainInstrumentor

LangchainInstrumentor().instrument()
Traces follow the GenAI conventions, so your LangChain chains are observable across any OpenTelemetry-aware platform.
LlamaIndex + OpenInference
LlamaIndex integrates with OpenInference, a set of conventions built on top of OpenTelemetry for AI observability. OpenInference spans are valid OTLP traces, so you get the same portability as native OpenTelemetry.
OpenLLMetry by Traceloop
OpenLLMetry is a collection of OpenTelemetry instrumentations for LLM apps. It provides ready-made instrumentation for LangChain, Anthropic, Ollama, Pinecone, Qdrant, and many other LLM-adjacent services. Because it’s built on OpenTelemetry, any instrumentation you install works with any OTLP backend.
Notable tools and SDKs
The OpenTelemetry ecosystem for agents includes:
- OpenTelemetry Python SDK: the core SDK for Python agents. Use this as your foundation for any Python-based agent instrumentation.
- OpenTelemetry JavaScript SDK: the equivalent for Node.js and browser-based agents.
- OpenLLMetry: pre-built instrumentations for LangChain, Anthropic, OpenAI, LlamaIndex, Ollama, Qdrant, and others. Reduces boilerplate if your agent uses popular frameworks.
- OpenInference by Arize: a semantic convention and instrumentation set for AI workloads. Integrates with OpenTelemetry and works with any OTel backend, including Arize Phoenix, Jaeger, and Datadog.
- Phoenix by Arize: an open-source observability tool for ML and LLM apps that consumes OpenInference (and thus OpenTelemetry) traces.
- Collector distributions: OpenTelemetry Collector is the standard. Vendor-specific distributions (e.g., Datadog Agent, New Relic Agent) also speak OTLP.
Common questions
- Why are my LLM calls showing up as HTTP spans instead of GenAI spans?
- You probably have base HTTP instrumentation without an LLM-aware layer on top. The default OpenTelemetry HTTP instrumentation captures your LLM API calls as plain HTTP spans (POST /v1/messages, 200 OK, 142ms). They show up. They're just missing the actually-useful attributes: model name, token counts, response ID. To get GenAI semantic-convention spans, install an LLM-aware instrumentor: OpenLLMetry's Anthropic or OpenAI instrumentor, OpenInference, or use a framework that emits GenAI spans natively (Claude Code, LangChain via its OTel package). Install the instrumentor (e.g., opentelemetry-instrumentation-anthropic from OpenLLMetry) and initialize it before your code creates the LLM client. After that, calls to client.messages.create() should produce gen_ai.* spans alongside the HTTP spans, and you can filter on gen_ai.system in your backend.
- Which OpenTelemetry SDK should I use with my agent framework?
- Depends on your language and framework. Python agents use the OpenTelemetry Python SDK. If you're on LangChain, LlamaIndex, or another framework, look for that framework's OTel instrumentation package first (via OpenLLMetry or framework-native support). If no instrumentation exists, you can hand-instrument your code using the SDK directly.
- What's OTLP?
- OTLP is the OpenTelemetry Protocol: the wire format and transport mechanism for sending telemetry data from your SDK to a collector or backend. It's built on Protocol Buffers and runs over gRPC or HTTP/1.1. You don't configure OTLP directly. You set environment variables like OTEL_EXPORTER_OTLP_ENDPOINT to point your SDK at a backend.
- Does setting CLAUDE_CODE_ENABLE_TELEMETRY=1 send my data to Anthropic?
- No. The flag tells Claude Code to emit OpenTelemetry traces to whatever OTLP endpoint you configure via OTEL_EXPORTER_OTLP_ENDPOINT. If you don't set an endpoint, the SDK has nowhere to send them and they're dropped on the floor. Anthropic doesn't receive your traces from this path. That's distinct from Anthropic's usage-and-billing telemetry, which is sent to Anthropic regardless of the OTel flag because it's how the API gets metered. The OTel data is for you: send it to Datadog, Grafana, a local Jaeger, or wherever you run observability.
- How do I set up telemetry export in my agent?
- Standard pattern: install the OpenTelemetry SDK for your language, install instrumentation packages for your frameworks (LangChain, Anthropic, and so on), initialize the instrumentation in your agent startup code, then set OTEL environment variables to point at your backend. The variables you'll need are OTEL_EXPORTER_OTLP_ENDPOINT (your backend's OTLP endpoint), OTEL_EXPORTER_OTLP_PROTOCOL (grpc or http/protobuf), and OTEL_EXPORTER_OTLP_HEADERS (auth headers, if needed). Your backend's documentation will list the specific OTLP endpoint URL to use.
- Can I use OpenTelemetry with multiple backends simultaneously?
- Yes. Configure multiple exporters in your SDK, or use an OpenTelemetry Collector to fan telemetry out to multiple destinations. Common during a backend migration, or when you want redundancy.
Further reading
- OpenTelemetry GenAI semantic conventions specification.
- OTLP protocol specification.
- Claude Code environment variables and telemetry setup.
- OpenLLMetry documentation and instrumentations.
- OpenInference specification for AI observability.
See also: What is agent observability?, Agents 101: Reasoning, Actions & Autonomy.